NFL Draft Recap: Day 1 Instant Rookie Reactions
Dig into the fantasy fallout from the first round of the NFL draft with analysis for each pick including looks at Michael Penix's fit in Atlanta and Malik Nabers' fit in New York.
Featured
Recent
Fantasy
DFS
Betting

MLB FAAB Factor: More Than the NFL Draft Happening
Jorge Martin, check in with Thursday FAAB, and his pickups include the Orioles' Heston Kjerstad who might hit his way to the lineup before too long.
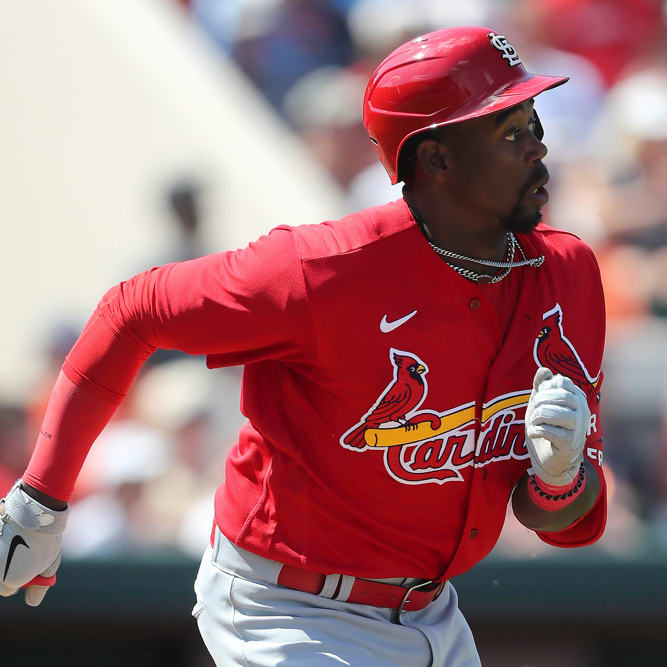
Collette Calls: Walker in Memphis; Does He Have a Prayer There?
Jordan Walker has been demoted in April for the second year in a row. What went wrong this time around?

What Does It Mean for Jared Jones to Be This Good This Early?
Erik Halterman does a deep dive on Jared Jones' hot early season start and whether or not it's sustainable.
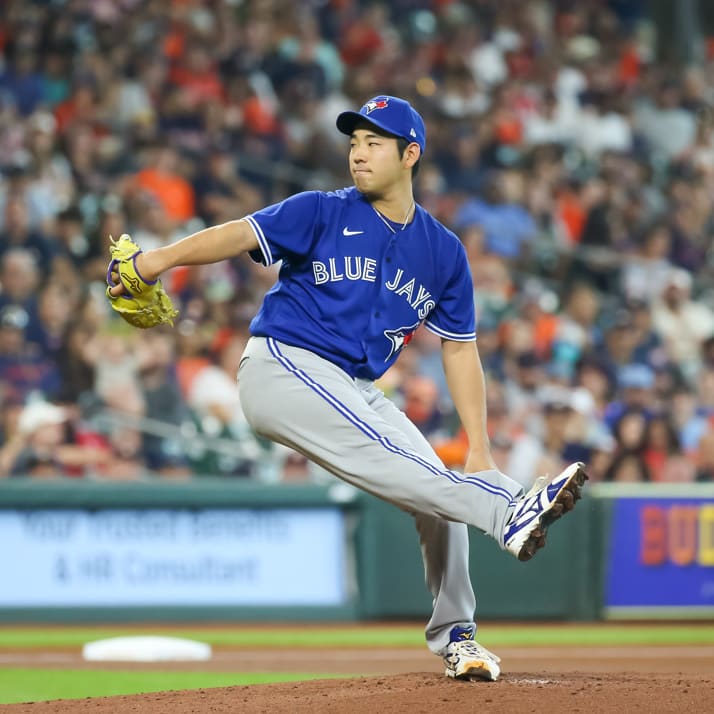
Mound Musings: Their Stock Is on the Rise
Brad Johnson highlights a few pitchers who have impressed him in the early-going of the season, starting with Toronto's Yusei Kikuchi.

NFL Draft: Final Three-Round Mock
Mario Puig attempts to decode the 2024 NFL Draft after the presumed first and second picks of Caleb Williams and Jayden Daniels.

MLB Points Leagues: Using wOBA to Identify Hitters
Dan Marcus uses advanced metrics to try and identify under-rostered hitters, such as the Padres' Jurickson Profar.

Browse All Fantasy Articles
Check out our full list of fantasy articles now.


Top News

Blake CorumNFL
Adds competition for Kyren Williams

Malachi CorleyNFL
Big Apple bound

Ben SinnottNFL
Goes to Washington

Ja'Lynn PolkNFL
Links up with Maye in New England

Ladd McConkeyNFL
Los Angeles picks up in Round 2

Keon ColemanNFL
Buffalo bound to start Round 2

Kawhi LeonardNBA
Good to go for Game 3

Manny MachadoMLB
Starting at third base Friday

Wade MileyMLB
Requires Tommy John surgery

Kodai SengaMLB
Facing hitters Monday

Jesus LuzardoMLB
Moves to injured list

Jackson HollidayMLB
Sent back to Triple-A
Fantasy Football
Fantasy Baseball
Fantasy Basketball

Fantasy Hockey


Fantasy Soccer


Fantasy Golf
College Football


College Basketball


Mixed Martial Arts
Fantasy NASCAR
Canadian Football


WNBA


EuroLeague


New users can unlock $1,000 in bonus bets for Friday NBA & NHL odds when they sign up with Caesars Sportsbook promo code ROTO1000. Bet on Bucks-Pacers, Suns-TWolves & Clippers-Mavs.
New users can grab $200 in bonus bets when they wager $5 or more on Friday night NBA odds & NHL picks with the latest DraftKings promo code.
New users can unlock $50 in instant bonus bets when they use the Fanatics Sportsbook promo Massachusetts and wager on Celtics or Bruins odds.
Check out the latest betting promos
→